Understanding mean median and mode in statistics is the first real step toward making sense of numbers in any dataset. Whether you're looking at test scores, monthly expenses, or customer ratings, these three measures of central tendency tell you where the "center" of your data sits. They sound simple, and they are, but knowing when to use each one separates someone who can read a spreadsheet from someone who can actually interpret it.
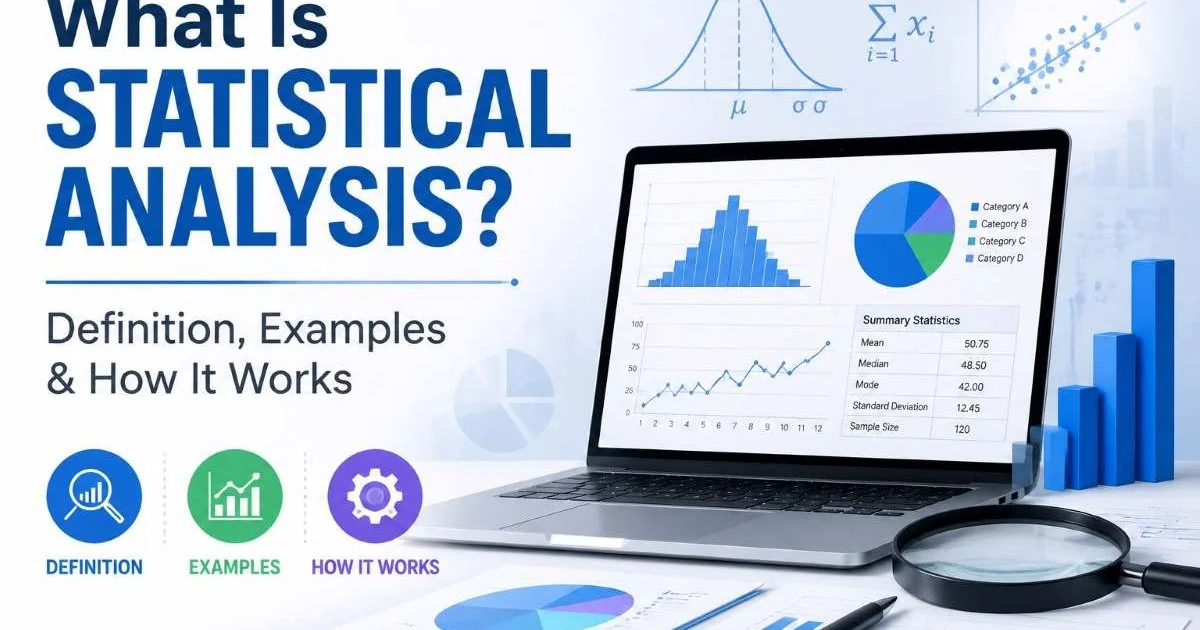
This guide walks you through calculating each measure, choosing the right one for your situation, and avoiding common mistakes. If you're a beginner data learner who wants to build a solid foundation in statistical analysis and how it works, these three concepts are where everything begins. By the end, you'll have practical skills you can apply to real data today.
Key Takeaways
- The mean adds all values and divides by the count, giving you the arithmetic average.
- The median finds the exact middle value when data is sorted in order.
- The mode identifies the most frequently occurring value in any dataset.
- Outliers can distort the mean, making the median a more reliable choice sometimes.
- Choosing the right measure depends on your data distribution and analysis goal.
Step 1: Calculate the Mean
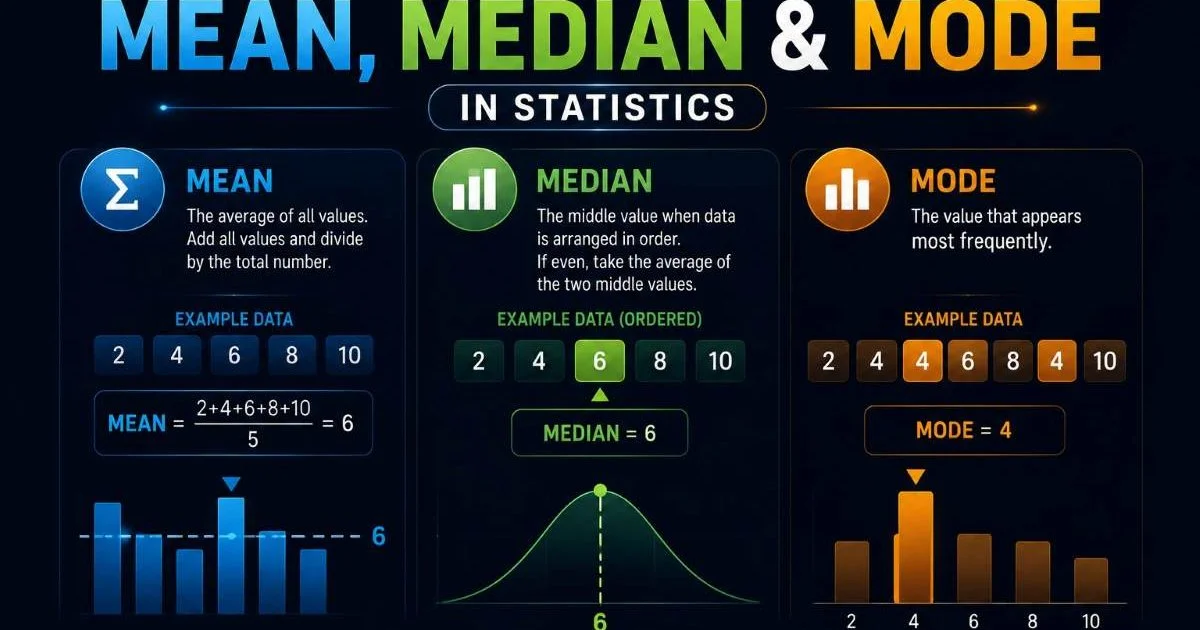
The mean is what most people think of when they hear the word "average." You calculate it by adding up every value in your dataset and dividing by the total number of values. For example, if five students scored 72, 85, 90, 68, and 95 on an exam, you add those together to get 410, then divide by 5. The mean score is 82. This single number gives you a quick snapshot of the overall performance level.
The formula is straightforward: Mean = Sum of all values / Number of values. In spreadsheet tools, you'd use a function like AVERAGE(). In Python, NumPy's np.mean() does the job in one line. The mean works with any quantitative data, from sales figures to temperature readings. It's the most widely used statistical measure across fields like finance, healthcare, and education.
When the Mean Works Best
The mean performs well when your data is roughly symmetrical and doesn't contain extreme outliers. Think of a dataset like daily temperatures in June for a specific city. The values tend to cluster together without dramatic spikes, so the mean gives you a genuinely useful summary. Businesses frequently use the mean to track metrics like average order value or average customer satisfaction scores. If you're exploring common data analysis methods and when to use them, you'll find the mean at the heart of most descriptive approaches.
A single extreme outlier can drag the mean far from the typical value. Always check your data for anomalies before relying on it.
However, the mean has a weakness. Imagine those same five test scores, but one student scored 20 instead of 68. The new mean drops to 72.4, which no longer represents the majority of the class. This sensitivity to outliers is precisely why understanding mean median and mode in statistics matters; you need to know when to switch to a different measure. The mean tells the truth about totals but can lie about what's typical.
Step 2: Find the Median
The median is the middle value when you arrange all data points from smallest to largest. Using our original exam scores (68, 72, 85, 90, 95), the median is 85 because it sits right in the center with two values below and two above. Unlike the mean, the median doesn't care about how extreme the highest or lowest values are. This makes it exceptionally useful for skewed data, like household income or real estate prices, where a few very high values can pull the mean upward.
Finding the median requires sorting your data first. For odd-numbered datasets, pick the middle value directly. The position formula is (n + 1) / 2, where n is the count. With 5 values, the median is at position 3. With 11 values, it's at position 6. This step is mechanical and almost impossible to get wrong once you've sorted correctly. Many top-performing LLMs for math can handle median calculations instantly, but doing it manually builds intuition.
Handling Even-Numbered Datasets
When your dataset has an even number of values, no single middle value exists. Instead, you take the two middle values and calculate their average. Suppose six students scored 68, 72, 85, 90, 92, and 95. The two middle values are 85 and 90, so the median is (85 + 90) / 2 = 87.5. This averaged median still resists the pull of outliers and accurately reflects the center of the distribution.
Always sort your data before finding the median. An unsorted list will give you the wrong answer every time.
The median is the preferred measure for income data because income distributions are heavily right-skewed. The U.S. Census Bureau reports median household income rather than mean income precisely for this reason. A few billionaires can inflate the mean, but the median stays anchored to the experience of the typical household. When you see median values reported in news articles or government reports, that's a deliberate statistical choice, not an arbitrary one. Understanding this distinction is fundamental to chart interpretation and reading data responsibly.
Step 3: Identify the Mode
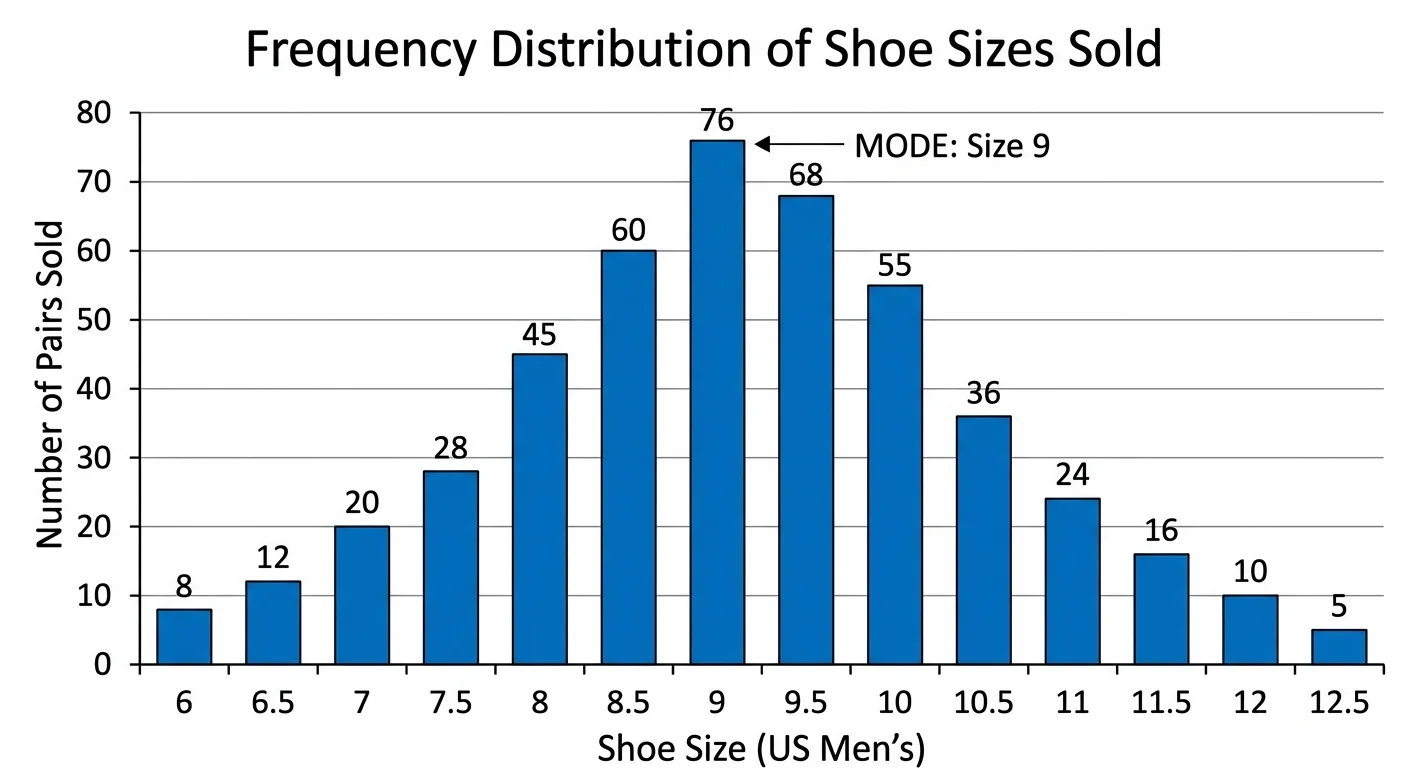
The mode is the value that appears most frequently in a dataset. If a shoe store sells sizes 7, 8, 8, 9, 9, 9, 10, 10, and 11, the mode is 9 because it occurs three times. Unlike the mean and median, the mode works with categorical data too. You can find the mode of a dataset containing colors, product names, or survey responses like "Agree," "Disagree," and "Neutral." This versatility makes the mode valuable in market research, manufacturing, and quality control.
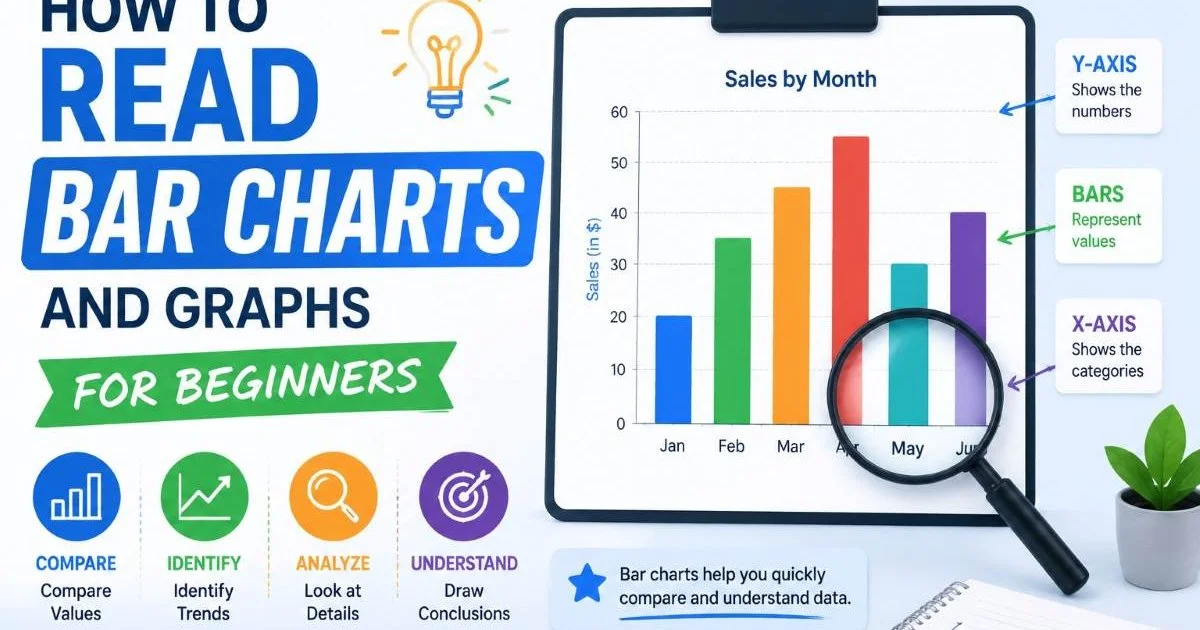
Calculating the mode requires counting the frequency of each value. In small datasets, you can do this by hand. For larger datasets, frequency tables or histogram charts make the process faster. If you're learning how to read bar charts and graphs as a beginner, notice that the tallest bar in a histogram corresponds to the mode. This visual connection between chart interpretation and statistical basics is worth internalizing early.
Multimodal Datasets
Some datasets have more than one mode. A dataset with two modes is called bimodal; three or more modes make it multimodal. For example, if a clothing retailer sells equal quantities of sizes Small and Large, with fewer Medium sales, the dataset is bimodal. This pattern often reveals distinct subgroups within your data, like two different customer demographics shopping at the same store. Recognizing multimodal distributions is a sign of growing statistical maturity.
Some datasets have no mode at all. If every value appears exactly once, the mode is undefined, which is perfectly fine.
A dataset can also have no mode when all values are unique. Test scores of 72, 85, 90, 68, and 95 have no repeating value, so no mode exists. This isn't a problem; it simply means frequency analysis isn't informative for that particular dataset. The mode is especially powerful in contexts like quality control, where finding the most common defect type helps prioritize fixes. Understanding mean median and mode in statistics means knowing that each measure has situations where it shines and situations where it's irrelevant.
Step 4: Choose the Right Measure for Your Data
Knowing how to calculate all three measures is only half the skill. The real value comes from choosing the right one for your specific situation. Symmetric data with no outliers? Use the mean. Skewed data with extreme values? The median is your friend. Categorical data or frequency analysis? Go with the mode. This decision-making process is a core part of understanding mean median and mode in statistics and separates raw calculation from genuine analysis.
Consider a real-world scenario: a startup tracking employee salaries. Five employees earn $45,000, $50,000, $52,000, $55,000, and $200,000. The mean salary is $80,400, which doesn't represent anyone's actual pay. The median is $52,000, which much better describes the typical employee's experience. If you're building a budget or compensation report, choosing the wrong measure would lead to misleading conclusions. This kind of judgment is exactly what the basics of statistics for beginners should teach first.
Comparing All Three Measures
| Feature | Mean | Median | Mode |
|---|---|---|---|
| Best for | Symmetric, continuous data | Skewed data with outliers | Categorical or frequency data |
| Affected by outliers? | Yes, heavily | No | No |
| Data type required | Quantitative only | Quantitative only | Quantitative or categorical |
| Always unique? | Yes | Yes | No (can be multimodal) |
| Common use case | GPA, average revenue | Income, home prices | Survey responses, defect types |
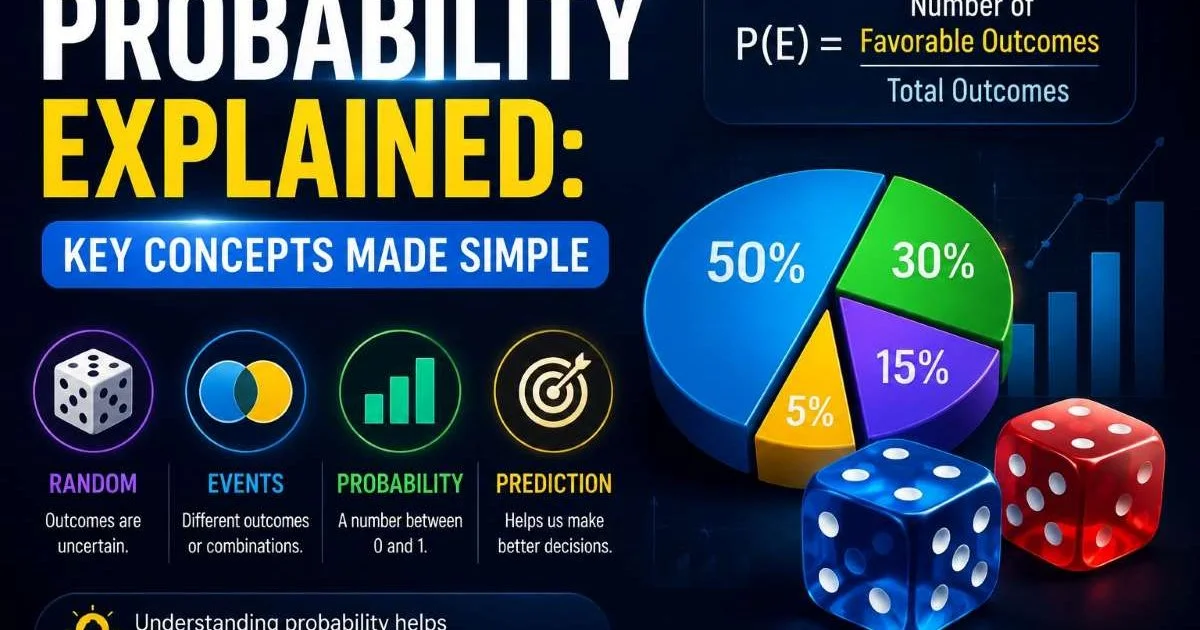
In practice, experienced analysts often calculate all three measures together. When the mean, median, and mode are close to each other, the data is roughly symmetrical. When they diverge, the distribution is skewed, which signals that further investigation is needed. This relationship between the three measures connects directly to probability and key statistical concepts, because distribution shape affects how likely certain outcomes are. Reporting all three gives your audience a richer, more honest picture.
"The measure of center you choose shapes the story your data tells. Choose deliberately, not by default."
Software tools make this even easier. Whether you're working in Excel, Google Sheets, R, or Python, built-in functions compute all three measures instantly. But the tool can't tell you which number to put in your report. That judgment call requires understanding your data's shape, your audience, and your goal. Even automated pipelines benefit from human oversight here, much like how static code analysis detects hidden issues that automated builds might miss. Context always matters more than computation.
When presenting data to non-technical stakeholders, report the median alongside the mean and briefly explain why they differ. This builds trust and transparency.
Frequently Asked Questions
?How do I calculate the median when my dataset has an even number of values?
?When should I use the median instead of the mean for income data?
?How long does it realistically take to learn mean, median, and mode well enough to apply them?
?Is it a mistake to always rely on the mean when analyzing test scores?
Final Thoughts
Understanding mean median and mode in statistics gives you three distinct lenses for examining any dataset. The mean summarizes totals, the median resists outliers, and the mode highlights frequency. None of them is universally "best."
Your job as an analyst, even a beginning one, is to match the measure to the data and the question. Start applying these concepts to real numbers today, whether it's your monthly budget, a fitness tracker log, or a class project, and you'll build the statistical intuition that no formula alone can teach.
Disclaimer: Portions of this content may have been generated using AI tools to enhance clarity and brevity. While reviewed by a human, independent verification is encouraged.