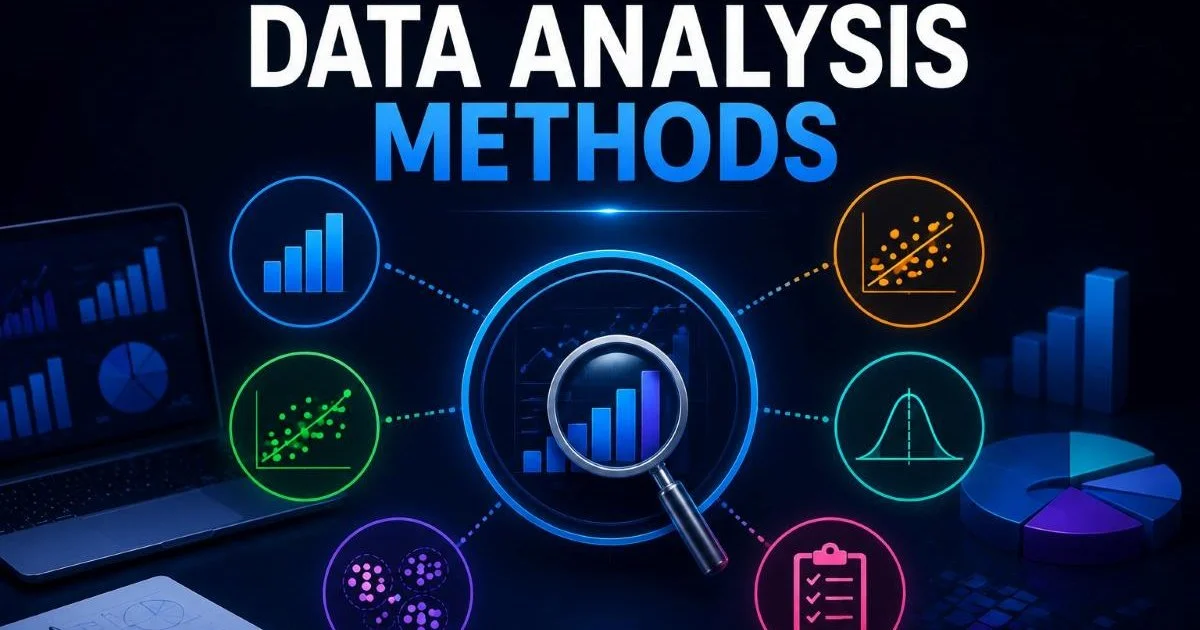
Common data analysis methods and when to use them is a topic every beginner data learner needs to understand before diving into spreadsheets, tools, or programming languages. Without knowing which method fits your question, you risk drawing wrong conclusions or wasting hours on the wrong approach. Think of it this way: a carpenter doesn't grab a random tool from the bench.
They pick the right one for the job. Data analysis works the same way. Whether you're summarizing customer feedback, predicting next quarter's revenue, or testing whether a new website design actually performs better, there's a specific method designed for that task.
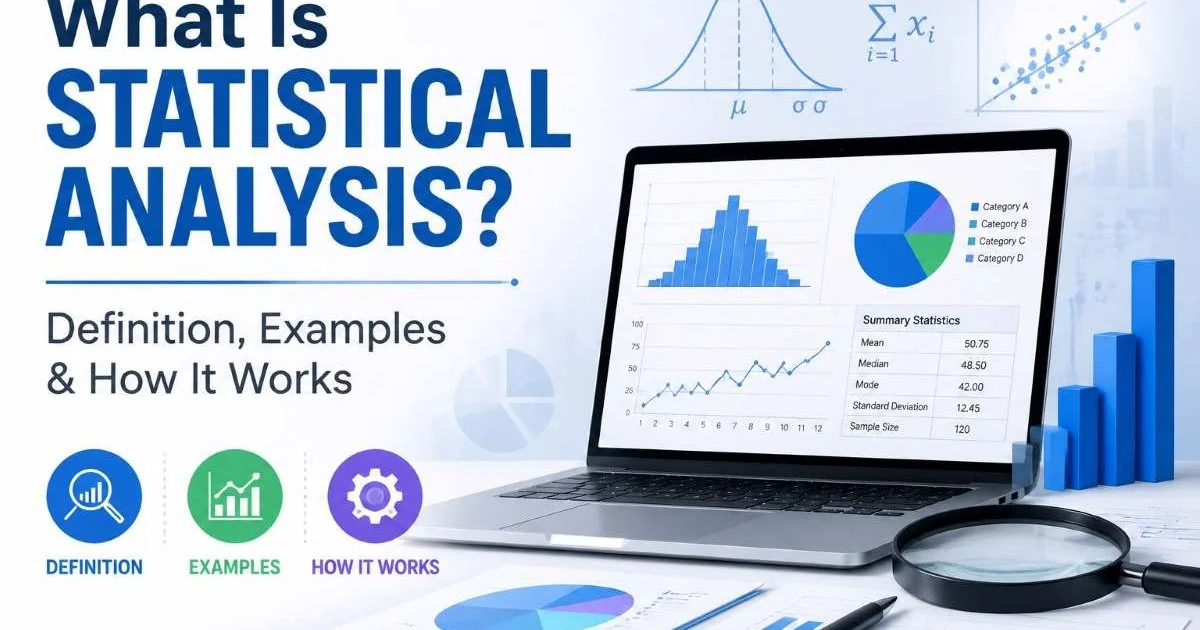
This guide walks you through the most practical methods, explains when each one shines, and gives you the confidence to choose wisely. If you're new to this field, you'll also want to understand what statistical analysis is, including definitions, examples, and how it works, as it forms the foundation for everything below.
Key Takeaways
- Descriptive analysis summarizes what already happened in your dataset using averages and counts.
- Inferential analysis lets you draw broader conclusions from a smaller sample of data.
- Regression analysis reveals relationships between variables and helps predict future outcomes.
- Choosing the wrong method leads to misleading results, so match method to question.
- Start simple with descriptive stats before moving to advanced techniques like regression.
Step 1: Understand the Core Categories of Common Data Analysis Methods
Descriptive Analysis
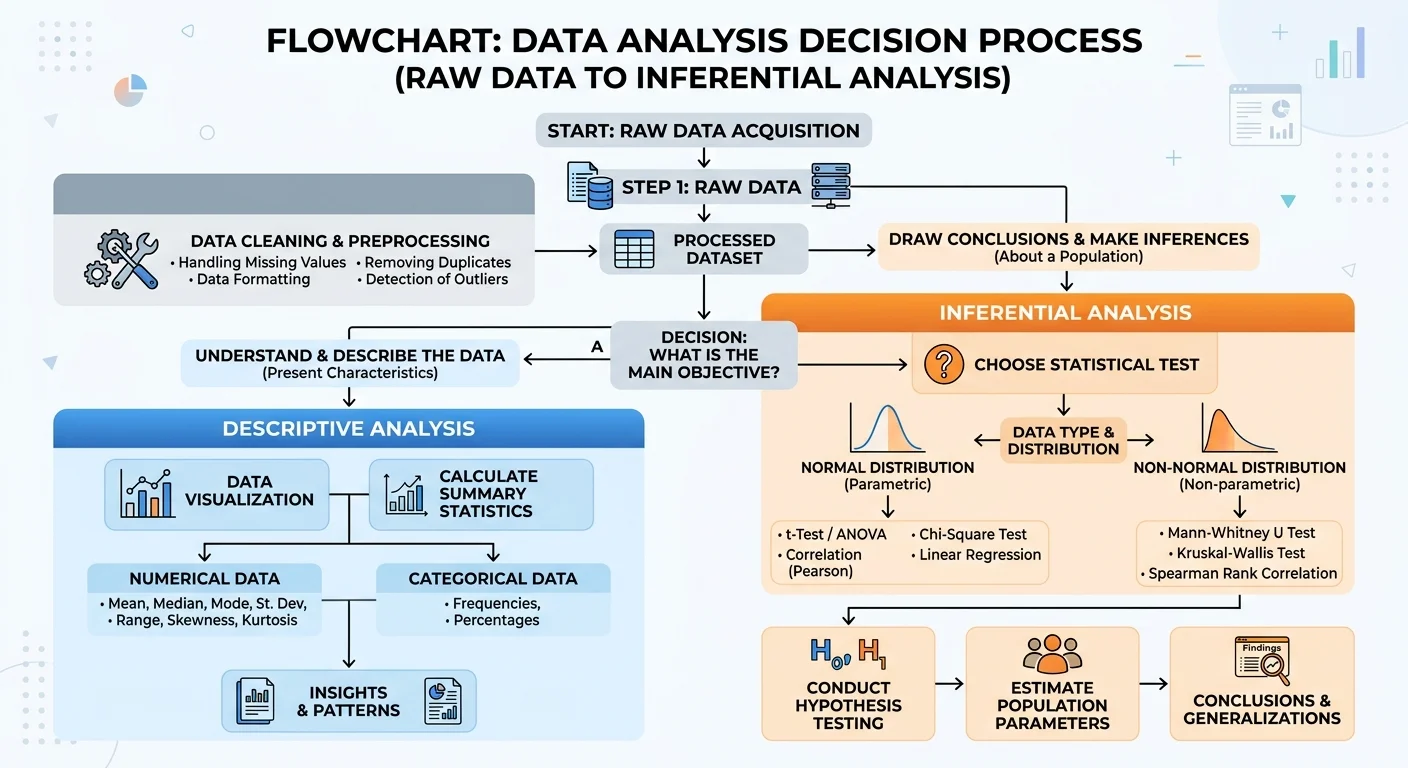
Descriptive analysis is where most beginners should start. It answers the question "what happened?" by summarizing raw data into meaningful numbers, charts, and tables. You calculate metrics like the mean, median, mode, and standard deviation. For example, a retail store might use descriptive analysis to find that its average transaction value last month was $47.30, with most purchases falling between $20 and $70. No predictions, no assumptions about the future. Just a clean snapshot of reality.
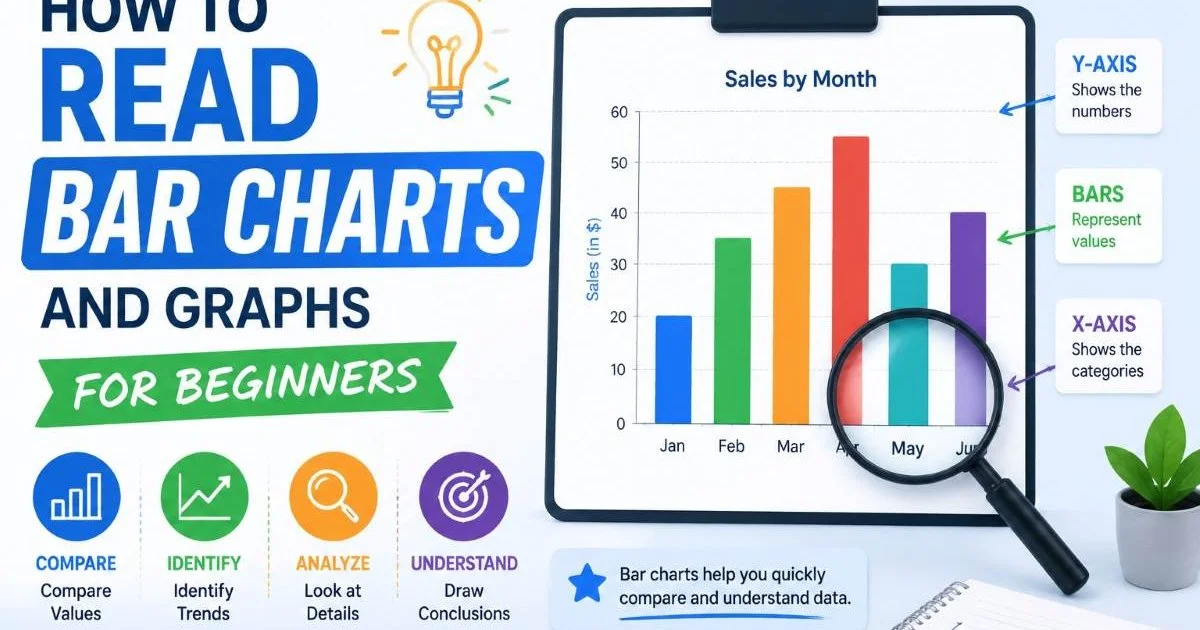
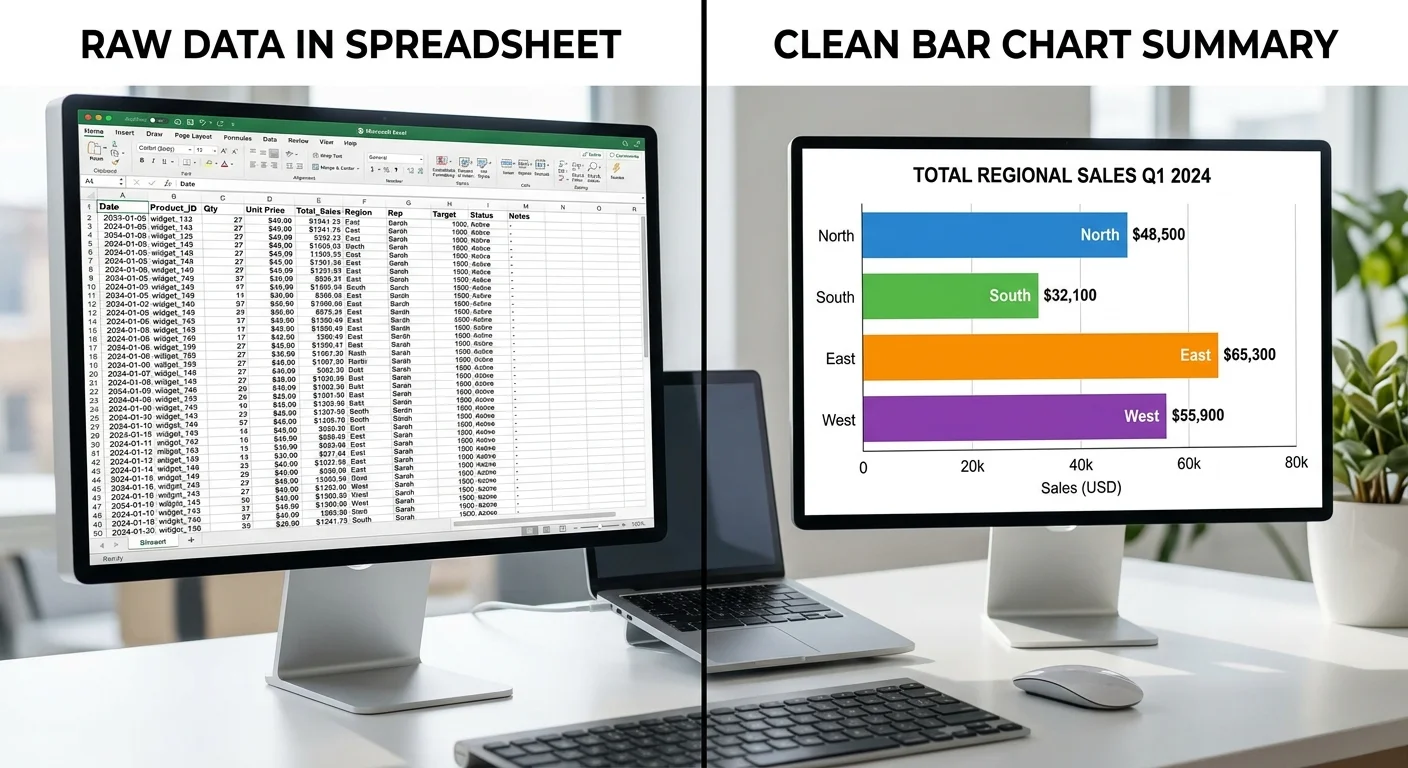
Visual tools play a big role in descriptive analysis. Bar charts, histograms, and pie charts help you spot patterns that raw numbers alone can hide. If you're just getting started with reading visual data, check out this guide on how to read bar charts and graphs for beginners. Chart interpretation is a skill that improves quickly with practice, and it makes your descriptive analysis far more intuitive. A well-designed bar chart can communicate in seconds what a spreadsheet takes minutes to reveal.
Always visualize your data before running any statistical tests. Patterns, outliers, and errors become obvious in charts.
Inferential Analysis
Inferential analysis takes you beyond description into the territory of drawing conclusions about a larger population based on a sample. Suppose you survey 500 customers out of 50,000. Inferential statistics lets you estimate, with a known margin of error, how the full customer base likely feels. This is where concepts like confidence intervals and p-values come into play. It's powerful but requires careful attention to sample size, randomness, and bias. For a deeper comparison of these two approaches, read about descriptive vs inferential statistics differences.
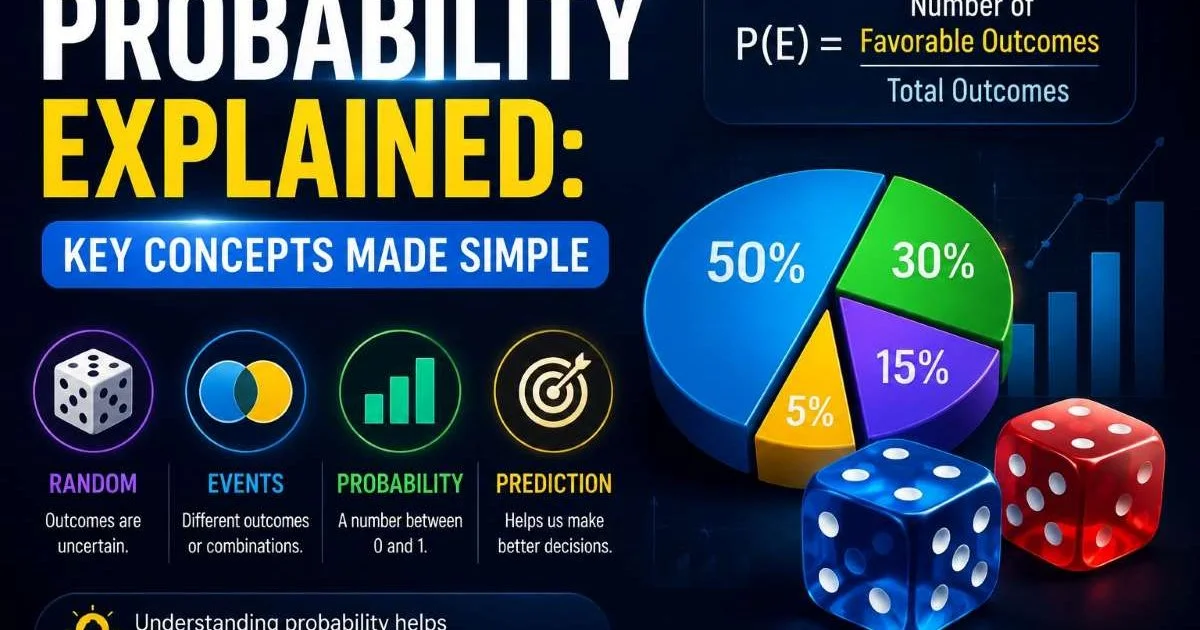
The biggest mistake beginners make with inferential analysis is using a biased or too-small sample. If you only survey customers who left positive reviews, your conclusions about overall satisfaction will be wildly optimistic. Probability explained in simple terms means understanding how likely your sample results reflect reality. A proper random sample with at least a few hundred observations usually gives you workable results for most business questions. Statistics for beginners becomes much less intimidating once you grasp this sampling logic.
Step 2: Learn Specific Methods and When to Apply Them
Regression and Correlation
Regression analysis is one of the most widely used statistical methods in both business and science. It examines the relationship between a dependent variable (what you're trying to predict) and one or more independent variables (what might influence it). A classic example: predicting house prices based on square footage, number of bedrooms, and neighborhood. Linear regression draws a "best fit" line through your data points, and the slope tells you how much the outcome changes for each unit change in the predictor.
Correlation is regression's simpler cousin. It tells you whether two variables move together, but not whether one causes the other. A correlation coefficient of 0.85 between ice cream sales and temperature means they rise together. A coefficient near zero means no linear relationship exists. Beginners often confuse correlation with causation, which is a trap worth avoiding. Just because two things move in tandem doesn't mean one drives the other. A third hidden variable could explain both.
Correlation does not imply causation. Always investigate whether a lurking variable explains both trends before drawing conclusions.
Hypothesis Testing
Hypothesis testing gives you a formal framework for making decisions based on data. You start with a null hypothesis (nothing has changed or there's no effect) and an alternative hypothesis (something has changed). Then you collect data and calculate whether the observed results are statistically significant. For example, an e-commerce company might test whether a redesigned checkout page reduces cart abandonment. If the p-value falls below 0.05, they'd reject the null hypothesis and conclude the redesign made a real difference.
Common tests include the t-test (comparing two group means), chi-square test (comparing categorical data), and ANOVA (comparing three or more group means). Each test has specific requirements about data type and distribution. The t-test works best with continuous data that's roughly normally distributed. Chi-square handles categorical data like survey responses or yes/no outcomes. Picking the wrong test produces unreliable results, so understanding your data type is the first step. Probability explained through key concepts will help you understand the math behind these significance tests.
"The method you choose matters less than whether it matches the question you're asking."
Step 3: Match Your Question to the Right Method
Understanding common data analysis methods and when to use them really comes down to asking the right question first. Before touching any data, write down exactly what you want to know. "What was our average revenue per customer last quarter?" is a descriptive question. "Will revenue increase if we raise prices by 10%?" requires predictive modeling. "Did our marketing campaign actually increase signups?" calls for hypothesis testing. The question dictates the method, not the other way around.
Here's a practical reference table that maps question types to methods. Bookmark this or print it out. Having it nearby while you work prevents the common beginner mistake of defaulting to the same technique for every problem. Analysis basics start with this kind of structured thinking.
| Question Type | Example Question | Best Method | Output |
|---|---|---|---|
| What happened? | What's our average order value? | Descriptive statistics | Mean, median, charts |
| Is there a relationship? | Does ad spend affect sales? | Correlation / Regression | Coefficient, trend line |
| Did something change? | Did the new layout improve clicks? | Hypothesis testing (t-test) | p-value, significance |
| What will happen next? | What will Q3 revenue look like? | Time series forecasting | Predicted values |
| How do groups differ? | Do customer segments behave differently? | ANOVA / Cluster analysis | Group comparisons |
Some questions require combining methods. You might use descriptive stats first, then follow up with regression to explain what you found.
Modern tools make it easier than ever to apply these methods without writing code from scratch. Spreadsheet software handles descriptive statistics and basic charts. Python and R open up regression, hypothesis testing, and machine learning. For those exploring AI-powered options, the best LLMs for data analysis can help automate pattern recognition and even suggest which method fits your dataset. The tool matters less than your understanding of why you're using it.
One underappreciated aspect of choosing the right method is data quality. Garbage in, garbage out applies to every technique listed above. Before running any analysis, check for missing values, duplicate records, and obvious outliers. A regression model trained on data with entry errors will confidently give you wrong predictions. Spend at least 30% of your analysis time cleaning and exploring data. This step feels tedious, but it separates reliable analysis from misleading results.
Step 4: Put Methods into Practice with Real Examples
Let's walk through a realistic scenario. Imagine you manage a small online store selling handmade candles. Last month, you ran a promotion offering free shipping on orders over $35. You want to know if it worked. Start with descriptive analysis: calculate average order value before and during the promotion. If the average jumped from $32 to $41, that's a promising sign. But you need more than a promising sign to make a business decision.
Next, apply hypothesis testing. Run a two-sample t-test comparing order values from the two periods. If your p-value comes back at 0.02, you can confidently say the free shipping threshold increased order values, and the result wasn't just random noise. This is how common data analysis methods and when to use them plays out in practice. You don't start with the fanciest method. You start simple, then layer on more rigorous techniques to confirm what you found.
Document every analysis step. Future you will thank present you when a stakeholder asks how you reached your conclusion.
For a more complex example, consider a software team trying to reduce bugs in production. They might use descriptive analysis to quantify current bug rates, then regression to identify which code modules produce the most defects. Interestingly, static code analysis can detect hidden vulnerabilities that complement statistical approaches by catching issues before they become data points. Combining domain-specific tools with statistical methods gives you a much fuller picture than either approach alone.
As you gain experience, you'll naturally develop intuition for which method to reach for. A marketing analyst who's run dozens of A/B tests will instinctively set up hypothesis tests. A financial analyst will default to time series models for forecasting. The key for beginners is to practice deliberately. Pick a small dataset, ask a question, choose a method, and interpret the results. Repeat this cycle with different datasets and different questions. Within a few months, common data analysis methods and when to use them will feel like second nature rather than an overwhelming menu of options.
Frequently Asked Questions
?How do I know when to move from descriptive to inferential analysis?
?Is regression analysis harder to learn than descriptive methods?
?How long does it take to run a proper hypothesis test on real data?
?What's the biggest mistake beginners make when choosing a data analysis method?
Final Thoughts
Common data analysis methods and when to use them isn't a topic you master overnight, but the basics are surprisingly approachable. Start with descriptive statistics to understand your data, move to inferential methods when you need to generalize, and use regression or hypothesis testing when specific questions demand rigorous answers.
The right method always depends on the question, the data type, and the decision you need to make. Practice with real datasets, stay curious about new techniques, and remember that even experienced analysts revisit these fundamentals regularly.
Disclaimer: Portions of this content may have been generated using AI tools to enhance clarity and brevity. While reviewed by a human, independent verification is encouraged.