Descriptive vs inferential statistics represents one of the most fundamental distinctions in all of data science. If you're just starting your journey into statistical analysis, understanding this split will shape how you approach every dataset you encounter. Descriptive statistics summarize what your data looks like right now. Inferential statistics take that summary and use it to make predictions about a larger population.
Both approaches are indispensable, and they serve very different purposes. Knowing when to use each one will save you from drawing wrong conclusions and help you communicate findings with confidence.
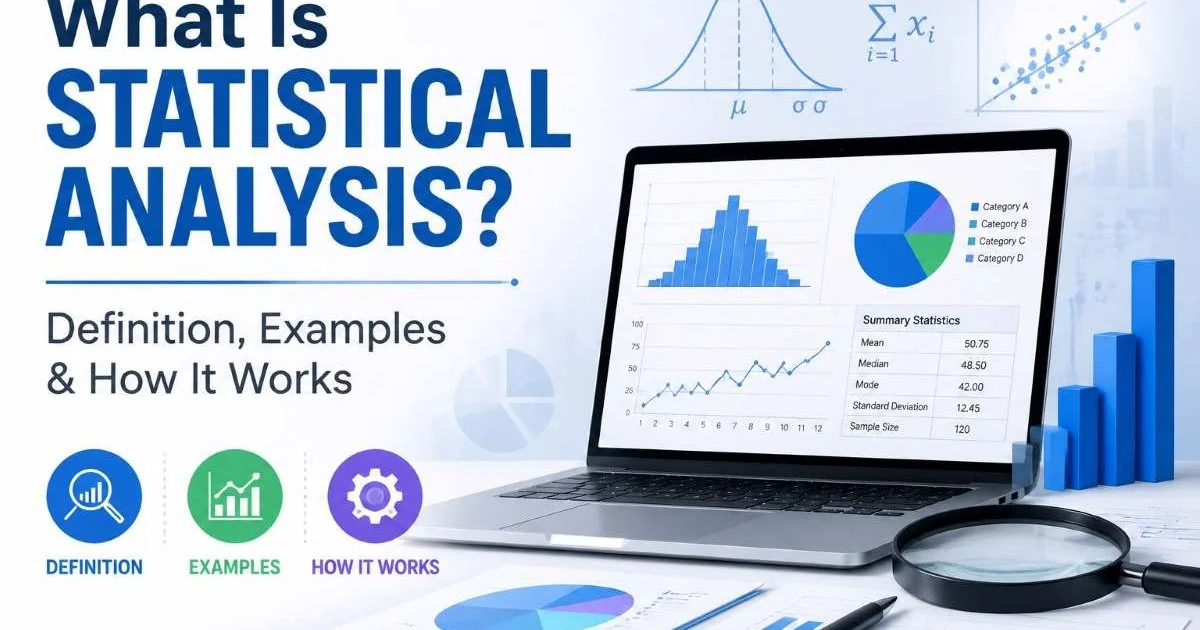
This article breaks down both types across clear comparison criteria so you can apply them correctly from day one. For a broader foundation, our guide on what statistical analysis is, with definitions and examples, provides helpful context before diving in here.
Key Takeaways
- Descriptive statistics summarize existing data; inferential statistics predict beyond it.
- Beginners should master descriptive methods before attempting inferential techniques.
- Inferential statistics always involve uncertainty, expressed through probability values.
- Charts and graphs primarily serve descriptive purposes by visualizing known data.
- Choosing the wrong type leads to misleading conclusions and flawed decisions.
What Each Type Does
Descriptive Statistics Overview
Descriptive statistics do exactly what the name suggests: they describe your data. Think of measures like the mean, median, mode, standard deviation, and range. These calculations take a raw dataset and compress it into understandable numbers. If you survey 500 people about their monthly income, the average income and the spread of responses are descriptive statistics that tell you what that specific group looks like.
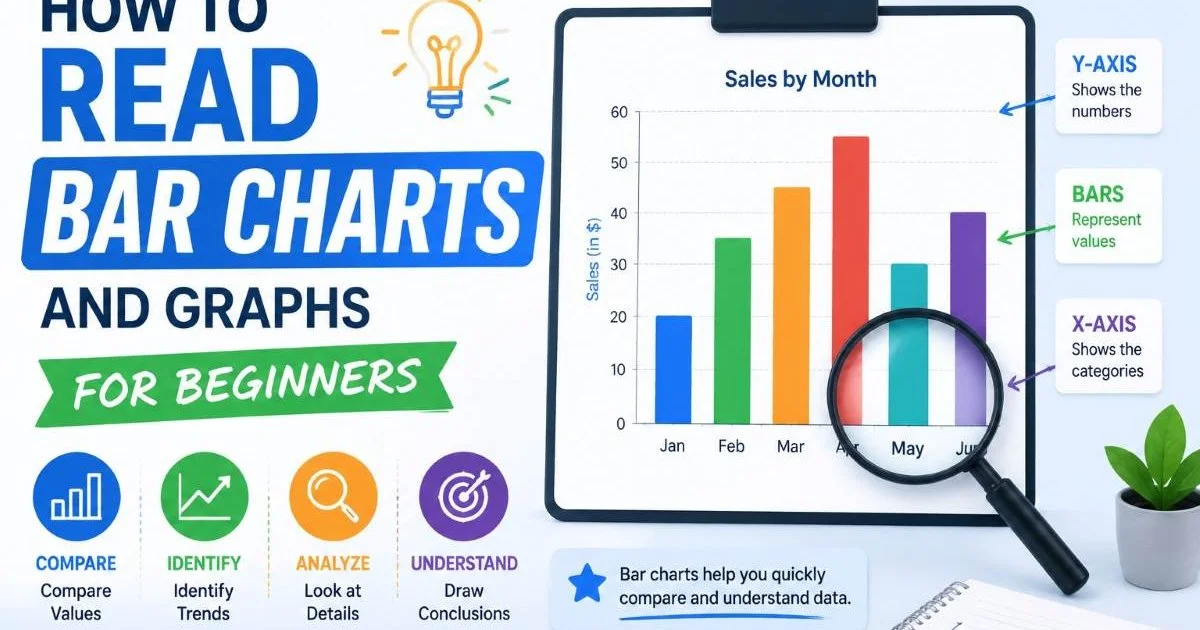
Visual tools play a major role in descriptive analysis. Bar charts, histograms, pie charts, and box plots all translate numbers into patterns your eyes can quickly process. If you're new to reading visual data, our guide on how to read bar charts and graphs for beginners is a great starting point. Chart interpretation becomes much easier once you understand what descriptive measures the visual is representing underneath.
One thing descriptive statistics cannot do is tell you anything about people or data points you haven't measured. Your calculations are limited to the dataset in front of you. That's not a weakness; it's the design. Descriptive methods give you a clean, honest picture of what you actually observed without any speculation or guessing involved.
Always calculate both the mean and median. If they differ significantly, your data is skewed.
Inferential Statistics Overview
Inferential statistics pick up where descriptive methods stop. They use sample data to make educated guesses about a larger population. When a political poll surveys 1,200 voters and predicts the outcome for an entire country, that's inferential statistics at work. The core idea is that a well-chosen sample can represent a much bigger group if you account for uncertainty mathematically.
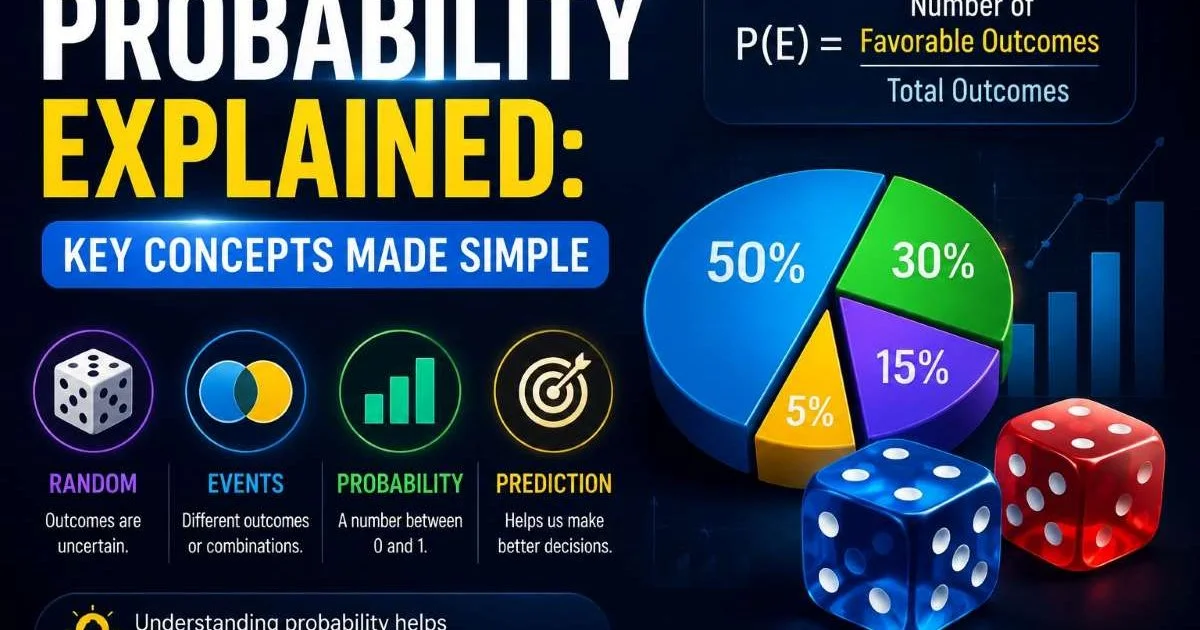
The tools of inferential statistics include hypothesis tests, confidence intervals, regression models, and analysis of variance (ANOVA). Each of these techniques relies on probability theory to quantify how confident you should be in your conclusions. For a refresher on these foundational ideas, probability explained with key concepts made simple covers the essentials well. Without probability, inferential statistics simply wouldn't function.
Every inferential result carries a margin of error. A 95% confidence interval, for instance, means you'd expect your estimate to be correct 95 out of 100 times if you repeated the study. This built-in uncertainty is what separates inference from description. You're no longer just reporting facts about your sample; you're making claims about the world beyond it.
Descriptive vs Inferential Statistics: Key Differences
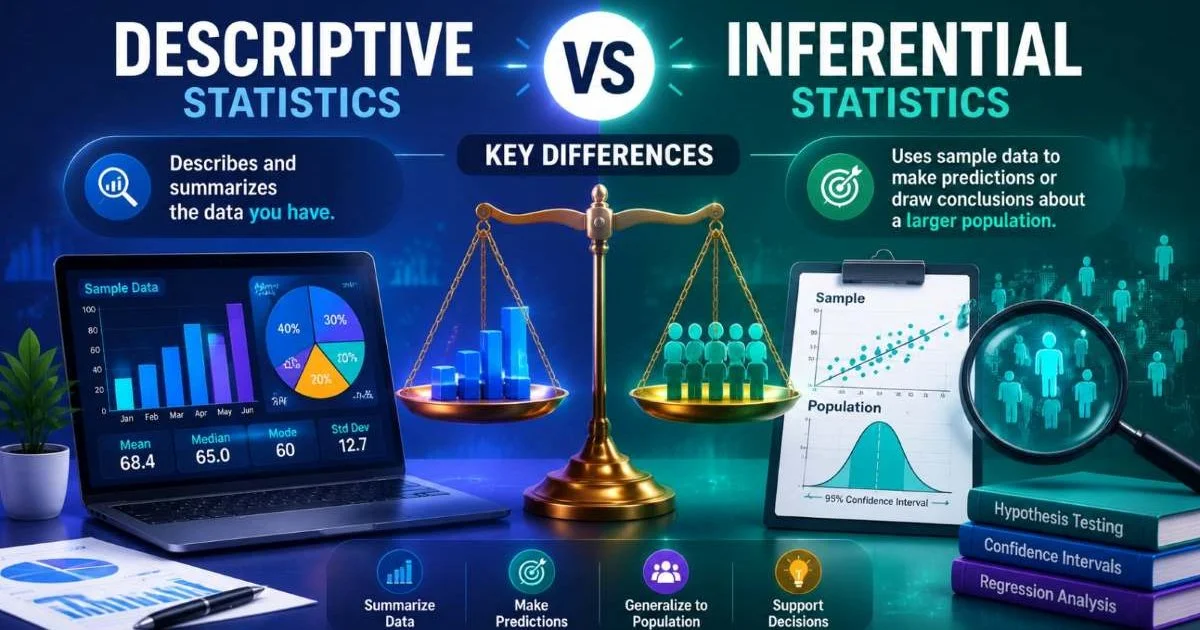
The most fundamental difference between descriptive vs inferential statistics is scope. Descriptive methods summarize data you already have. Inferential methods extrapolate from samples to populations you haven't fully measured. This distinction affects everything from the complexity of your calculations to the type of conclusions you're allowed to draw. Beginners often blur this line, which leads to overconfident claims based on simple averages.
Another key difference is the role of probability. Descriptive statistics don't need probability at all. You calculate an average, and that average is a fact about your dataset. Inferential statistics, by contrast, are built entirely on probabilistic reasoning. The p-value in a hypothesis test, for example, tells you the likelihood of observing your results if no real effect exists. This makes inferential work more powerful but also more prone to misinterpretation.
The complexity gap matters for beginners too. You can learn to calculate a mean and standard deviation in an afternoon. Mastering regression analysis or chi-square tests takes considerably more study. That said, you don't need to be an expert mathematician. Modern tools handle the computation; your job is understanding what the output means and whether your assumptions hold. Exploring common data analysis methods and when to use them can help you match the right technique to your situation.
Data requirements also differ significantly. Descriptive statistics work fine on any dataset, regardless of size. Inferential statistics demand careful sampling. If your sample isn't random or representative, your inferences become unreliable, no matter how sophisticated your math is. Sample size calculations, power analysis, and sampling design are all considerations that simply don't apply to descriptive work.
"Descriptive statistics tell you what happened. Inferential statistics tell you what it might mean."
| Criterion | Descriptive Statistics | Inferential Statistics |
|---|---|---|
| Purpose | Summarize and organize data | Generalize findings to populations |
| Scope | Limited to collected data | Extends beyond the sample |
| Key Tools | Mean, median, charts, tables | Hypothesis tests, regression, ANOVA |
| Probability Needed | No | Yes |
| Uncertainty | None (results are exact) | Always present (margins of error) |
| Sample Size Sensitivity | Low | High |
| Difficulty Level | Beginner-friendly | Intermediate to advanced |
When to Use Each Approach
Best Scenarios for Descriptive
Use descriptive statistics whenever your goal is to understand and communicate what your data contains. Business dashboards, annual reports, and academic data summaries all rely heavily on descriptive measures. If a company reports that its average customer satisfaction score is 4.2 out of 5, that's a descriptive statistic. No inference is needed because the company is reporting on the actual customers who responded.
Descriptive methods also shine in exploratory data analysis. Before running any inferential tests, experienced analysts always start by describing their data. They check the distribution shape, look for outliers, and calculate basic statistics for beginners to quickly understand the dataset's character. Skipping this step is like trying to navigate a city without looking at a map first. Even in fields like static code analysis that detects hidden vulnerabilities, the first step is always summarizing patterns in the data before drawing deeper conclusions.
Descriptive statistics are not "lesser" than inferential. They serve a different, equally important purpose.
Best Scenarios for Inferential
Inferential statistics become necessary when you can't measure the entire population. Medical trials are a classic example. Researchers test a new drug on a few hundred patients and use inferential methods to determine whether it would likely work for millions. Election forecasting, quality control in manufacturing, and A/B testing in technology all follow the same logic. Even studies analyzing trends like progressive web app statistics rely on inferential reasoning to project findings from samples to broader adoption patterns.
The decision to use inferential methods should always be deliberate. You need a clearly defined population, a representative sample, and a specific question you're trying to answer. "Is Drug A more effective than Drug B?" is an inferential question. "What was the average response time in our survey?" is descriptive. Mixing these up creates confusion. Many beginners accidentally apply inferential thinking to complete datasets, adding unnecessary uncertainty to results that are already definitive.
Common Mistakes Beginners Make
The most frequent mistake is treating descriptive results as if they're inferential. Calculating the average test score for 30 students in your class and then claiming it represents all students in the country is a logical leap that descriptive statistics cannot support. If you want to generalize, you need proper sampling methods and inferential techniques. This confusion is especially common in blog posts and news articles where writers present sample averages as universal truths without any mention of margins of error.
Another common error is ignoring assumptions. Inferential methods come with preconditions. Many tests assume your data follows a normal distribution. Others require independent observations or equal variance between groups. Violating these assumptions doesn't always produce an obvious error message, but it quietly corrupts your results. Before running any inferential test, check whether your data actually meets the method's requirements. Similar principles apply broadly; just as proper URL canonicalization prevents duplicate content issues, proper assumption checking prevents duplicate conclusions drawn from flawed analysis.
A statistically significant result does not automatically mean a practically important result. Always consider effect size.
Beginners also tend to over-rely on p-values. A p-value below 0.05 has become a mechanical threshold that many treat as a magic number. But statistical significance doesn't equal practical significance. A study might find a "significant" difference of 0.3 points on a 100-point scale. That's statistically real but practically meaningless. Always pair your inferential results with descriptive context, like effect sizes and confidence intervals, to give your audience the full picture.
Finally, small sample sizes plague beginner analyses. Running a t-test on five data points technically produces a result, but the confidence interval will be so wide that the finding is practically useless. Inferential statistics need adequate sample sizes to produce meaningful conclusions. A general rule of thumb for many basic tests is a minimum of 30 observations, though the required number varies significantly depending on the analysis type and the effect you're trying to detect.
Frequently Asked Questions
?How do I know if my dataset is skewed before running analysis?
?Can descriptive and inferential statistics be used on the same dataset?
?How long does it take a beginner to learn inferential before descriptive?
?Is using a bar chart enough to make predictions about a population?
Final Thoughts
Understanding descriptive vs inferential statistics is foundational for anyone working with data. Descriptive methods help you see and communicate what your data contains. Inferential methods let you responsibly extend those findings to broader populations. Neither type is superior; they answer fundamentally different questions.
Start by mastering descriptive basics, then build your inferential skills as your confidence grows. The ability to choose the right approach for each situation is what separates thoughtful analysis from misleading number crunching.
Disclaimer: Portions of this content may have been generated using AI tools to enhance clarity and brevity. While reviewed by a human, independent verification is encouraged.